


CONTENT TYPE
SUBJECT
- Number Sense (381)
- Number Recognition (30)
- Number Tracing (20)
-
Number Sequence
(56)
- Counting (141)
- Compare Numbers (47)
-
Compare Objects
(7)
-
Compare Numbers Using Place Value
(5)
-
Compare 2-Digit Numbers
(6)
-
Compare 3-Digit Numbers
(10)
-
Order Numbers
(15)
- Skip Counting (36)
-
Even And Odd Numbers
(3)
- Place Value (78)
- Round Numbers (16)
- Addition (369)
-
Add With Pictures
(38)
-
Addition Properties
(6)
- Addition Strategies (136)
- Compose And Decompose Numbers (66)
-
Count All To Add
(9)
-
Add Using A Number Line
(7)
-
Count On To Add
(11)
-
Add With 10
(2)
-
Doubles And Near Doubles Addition Strategy
(21)
-
Make 10 Strategy
(4)
-
Add Three Whole Numbers
(20)
- 2-Digit Addition (45)
- 3-Digit Addition (65)
- 4-Digit Addition (30)
- Large Numbers Addition (10)
- Subtraction (240)
-
Subtract With Pictures
(35)
- Subtraction Strategies (48)
- 2-Digit Subtraction (30)
- 3-Digit Subtraction (57)
- 4-Digit Subtraction (23)
- Large Numbers Subtraction (8)
- Multiplication (196)
- Multiplication Strategies (56)
-
Multiplication With Equal Groups
(16)
-
Multiplication With Arrays
(20)
-
Multiplication Sentences
(9)
-
Multiplication On A Number Line
(13)
-
Repeated Addition To Multiply
(17)
- Times Tables (88)
-
Multiplication By 2
(10)
-
Multiplication By 3
(10)
-
Multiplication By 4
(9)
-
Multiplication By 5
(10)
-
Multiplication By 6
(9)
-
Multiplication By 7
(8)
-
Multiplication By 8
(8)
-
Multiplication By 9
(9)
-
Multiplication By 10
(5)
-
Multiplication By 11
(5)
-
Multiplication By 12
(5)
- Multiplication Properties (15)
-
Multiply By Multiples Of 10
(8)
-
Estimate Products
(4)
- Multi-Digit Multiplication (40)
- Division (119)
-
Divide On A Number Line
(3)
- Division Facts (60)
-
Division By 2
(5)
-
Division By 3
(5)
-
Division By 4
(5)
-
Division By 5
(5)
-
Division By 6
(5)
-
Division By 7
(5)
-
Division By 8
(5)
-
Division By 9
(5)
-
Estimate Quotients
(4)
- Long Division (36)
- Fractions (186)
-
Fractions Using Models
(28)
-
Fractions On A Number Line
(10)
- Compare Fractions (22)
- Equivalent Fractions (25)
-
Mixed Numbers As Improper Fractions
(4)
- Fractions Operations (91)
- Decimals (138)
- Read And Write Decimals (40)
-
Compare Decimals
(22)
-
Order Decimals
(15)
- Round Decimals (12)
-
Convert Decimals To Fractions
(11)
- Decimal Operations (40)
- Geometry (129)
-
Positional Words
(5)
- Lines, Line Segments, Rays (6)
-
Angles
(15)
- Shapes (80)
- Partition Into Equal Parts (13)
-
Coordinate Plane
(7)
- Data Handling (46)
- Measurement (125)
- Length (34)
- Height (6)
-
Weight
(12)
-
Capacity
(12)
-
Conversion Of Measurement Units
(15)
-
Perimeter
(19)
-
Area
(18)
-
Volume
(8)
- Time (35)
-
Am And Pm
(2)
-
Time In Hours
(5)
-
Time In Half Hours
(4)
-
Time In Quarter Hours
(7)
-
Time To The Nearest 5 Minutes
(11)
-
Time To The Nearest Minute
(2)
-
Elapsed Time
(3)
- Money (60)
-
Identify Coins
(13)
-
Counting Money
(14)
-
Compare Money
(7)
-
Add And Subtract Money
(17)
-
Multiply And Divide Money
(7)
- Algebra (54)
-
Number Patterns
(29)
- Expressions And Equations (13)
-
Factors And Multiples
(7)
-
Prime And Composite Numbers
(5)
- Word Problems (97)
- Reading (2,269)
- Phonics (2,225)
- Bossy R (60)
-
Diphthongs
(22)
- Consonant Blends (118)
- Alphabet (262)
- Letter Recognition (262)
-
Letter A
(9)
-
Letter B
(9)
-
Letter C
(9)
-
Letter D
(9)
-
Letter E
(9)
-
Letter F
(9)
-
Letter G
(9)
-
Letter H
(9)
-
Letter I
(9)
-
Letter J
(9)
-
Letter K
(9)
-
Letter L
(9)
-
Letter M
(9)
-
Letter N
(9)
-
Letter O
(9)
-
Letter P
(9)
-
Letter Q
(9)
-
Letter R
(9)
-
Letter S
(9)
-
Letter T
(9)
-
Letter U
(9)
-
Letter V
(9)
-
Letter W
(9)
-
Letter X
(9)
-
Letter Y
(9)
-
Letter Z
(9)
-
Lowercase Letters
(78)
-
Uppercase Letters
(78)
-
Matching Lowercase And Uppercase Letters
(59)
- Alphabetical Order (54)
-
Letter Sounds
(130)
- Vowels (158)
- Long Vowel Sounds (75)
-
Long Vowel A Sound
(15)
-
Long Vowel E Sound
(17)
-
Long Vowel I Sound
(15)
-
Long Vowel O Sound
(15)
-
Long Vowel U Sound
(13)
-
Silent E
(12)
- Short Vowel Sounds (81)
-
Short Vowel A Sound
(59)
-
Short Vowel E Sound
(26)
-
Short Vowel I Sound
(59)
-
Short Vowel O Sound
(44)
-
Short Vowel U Sound
(24)
- Vowel Teams (65)
- Blending (432)
- Consonant Digraphs (8)
-
Double Consonants
(8)
-
Rhyming Words
(61)
-
Trigraphs
(38)
-
Three Letter Blends
(19)
- Sight Words (1,035)
- Reading Comprehension (44)
- Writing (124)
- Handwriting (124)
- Letter Tracing (124)
-
Letter Tracing A
(6)
-
Letter Tracing B
(6)
-
Letter Tracing C
(6)
-
Letter Tracing D
(6)
-
Letter Tracing E
(6)
-
Letter Tracing F
(6)
-
Letter Tracing G
(6)
-
Letter Tracing H
(6)
-
Letter Tracing I
(6)
-
Letter Tracing J
(6)
-
Letter Tracing K
(6)
-
Letter Tracing L
(6)
-
Letter Tracing M
(6)
-
Letter Tracing N
(6)
-
Letter Tracing O
(6)
-
Letter Tracing P
(6)
-
Letter Tracing Q
(6)
-
Letter Tracing R
(6)
-
Letter Tracing S
(6)
-
Letter Tracing T
(6)
-
Letter Tracing U
(6)
-
Letter Tracing V
(6)
-
Letter Tracing W
(6)
-
Letter Tracing X
(6)
-
Letter Tracing Y
(6)
-
Letter Tracing Z
(6)
- Food (60)
- Animals (58)
- Seasonal (28)
- Kitchen (11)
-
Musical Instruments
(30)
-
Birds
(20)
-
Space
(12)
- Transport (9)
-
Insects
(9)
-
Scene
(8)
-
Professions
(8)
-
Monuments
(8)
-
Household Items
(8)
-
Flowers
(8)
-
Buildings
(8)
-
Colors
(7)
-
Toys
(4)
- Coloring (181)
- Animals (32)
- Seasonal (28)
- Food (24)
- Transport (8)
-
Space
(8)
-
Scene
(8)
-
Professions
(8)
-
Musical Instruments
(8)
-
Monuments
(8)
- Kitchen (8)
-
Insects
(8)
-
Household Items
(8)
-
Flowers
(8)
-
Buildings
(8)
-
Birds
(8)
- Music (36)
-
Cooking
(7)
-
Stories
(10)
Number Sense Games
View all 381 games-
VIEW DETAILS
 Counting Backwards
Count back and Complete the Sequence Game
Practice the superpower of number sense by learning how to count back and complete the sequence.
-
VIEW DETAILS
 Number Recognition
Count Along with the Stars from 1 to 3 Game
Shine bright in the maths world by counting along with the stars from 1 to 3.
-
VIEW DETAILS
 Number Sequence
Count Along with the Stars from 1 to 5 Game
Count along with the stars from 1 to 5 with this number sense game.
-
VIEW DETAILS
 Number Tracing
Trace the Number One Game
Sharpen your number skills by tracing the number one.
Addition Games
View all 369 games-
VIEW DETAILS
 Add Three Whole Numbers
Compose Numbers to make 10 Game
Begin the exciting journey of becoming a maths wizard by learning how to compose numbers to make 10.
-
VIEW DETAILS
 Addition Properties
Identify Turn Around Facts Game
Add more arrows to your child’s maths quiver by identifying turn around facts.
-
VIEW DETAILS
 Addition Strategies
Add and Match Game
Take a look at how to add and match with this addition game.
-
VIEW DETAILS
 Add With Pictures
Model to Add Numbers Game
Dive deep into the world of maths by modeling to add numbers.
Subtraction Games
View all 240 games-
VIEW DETAILS
 Subtraction Strategies
Subtract and Match Game
Shine bright in the maths world by learning how to subtract and match.
-
VIEW DETAILS
 2-Digit Subtraction
Solve Word Problems on Take From Scenarios Game
Enjoy the marvel of maths-multiverse by learning to solve word problems on "Take From" scenarios.
-
VIEW DETAILS
 3-Digit Subtraction
Solve Scenarios with 'Difference Unknown' Game
Shine bright in the maths world by learning how to solve scenarios with 'Difference Unknown'.
-
VIEW DETAILS
 Subtract With Pictures
Remove and Match the Number Game
Enjoy the marvel of maths-multiverse by exploring how to remove and match the number.
Multiplication Games
View all 196 games-
VIEW DETAILS
 Multiply By Multiples Of 10
Multiply and Answer in Unit Form Game
Enjoy the marvel of maths-multiverse by exploring how to multiply and answer in unit form.
-
VIEW DETAILS
 Multiplication Strategies
Skip Count to Find the Answer Game
Use your maths skills to skip count to find the answer.
-
VIEW DETAILS
 Times Tables
Find Facts of 2 Game
Take a deep dive into the world of maths by finding facts of 2.
-
VIEW DETAILS
 Multiplication Properties
Multiply Three Numbers Game
Unearth the wisdom of mathematics by learning how to multiply three numbers.
Division Games
View all 119 games-
VIEW DETAILS
 Division Facts
Complete the Division Expression for Equal Groups Game
Take a look at how to complete the division expression for equal groups with this game.
-
VIEW DETAILS
 Estimate Quotients
Divide Each Expression and Match the Quotient Game
Kids must divide each expression and match the quotient to practice division.
-
VIEW DETAILS
 Long Division
Find the Quotient Game
Enter the madness of maths-multiverse by learning to find the quotient.
-
VIEW DETAILS
 Divide On A Number Line
Represent Division on Number Line Game
Have your own maths-themed party by learning how to represent division on number lines.
Fractions Games
View all 186 games-
VIEW DETAILS
 Order Fractions
Compare Unit Fractions without Visual Models Game
Have your own maths-themed party by learning how to compare unit fractions without visual models.
-
VIEW DETAILS
 Fractions Using Models
Partition into Equal Parts Game
Kids must partition into equal parts to practice fractions.
-
VIEW DETAILS
 Compare Fractions
Compare and Model Greater Fraction Game
Practice the superpower of fractions by learning how to compare and model greater fractions.
-
VIEW DETAILS
 Fractions On A Number Line
Missing Numerators on Number Lines Game
Have your own maths-themed party by learning how to find the missing numerators on number lines.
Decimals Games
View all 138 games-
VIEW DETAILS
 Read And Write Decimals
Identify Decimal Numbers Using Fraction Models Game
Add more arrows to your child’s maths quiver by identifying decimal numbers using fraction models.
-
VIEW DETAILS
 Order Decimals
Fill a Decimal Number Between the Two Tenths Game
Fill a decimal number between the two tenths to practice decimals.
-
VIEW DETAILS
 Compare Decimals
Compare Decimals Using Place Value Chart Game
Have your own maths-themed party by learning how to compare decimals using a place value chart.
-
VIEW DETAILS
 Round Decimals
Round Tenths Using a Number Line Game
Enter the madness of maths-multiverse by exploring how to round tenths using a number line.
Geometry Games
View all 129 games-
VIEW DETAILS
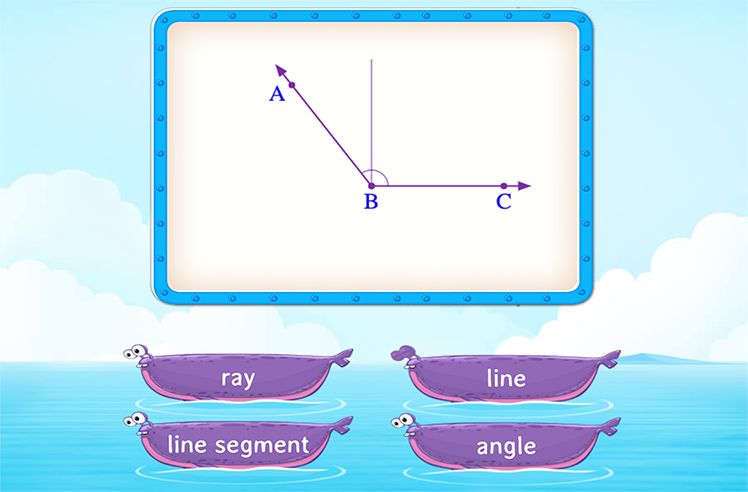 Lines, Line Segments, Rays
Recognize Lines, Line Segments, Rays, Angles Game
Dive deep into the world of geometry by recognizing lines, line segments, rays, angles.
-
VIEW DETAILS
 Shapes
Sort Real-World Shapes Game
Add more arrows to your child’s maths quiver by sorting real-world shapes.
-
VIEW DETAILS
 Positional Words
Identify Objects Above and Below Game
Learn to solve problems by identifying objects 'above' and 'below'.
-
VIEW DETAILS
 Angles
Find Right Angles Game
Take the first step towards building your maths castle by practicing how to find right angles.
Data Handling Games
View all 46 games-
VIEW DETAILS
 Line Plots
Read and Interpret Data using Line Plots Game
Kids must read and interpret data using line plots.
-
VIEW DETAILS
 Sorting Objects
Identify Objects by Color Game
Sharpen your skills by identifying objects by their colors.
-
VIEW DETAILS
 Picture Graphs
Complete Picture Graphs Game
Apply your knowledge of measurements to complete picture graphs.
-
VIEW DETAILS
 Bar Graphs
Read and Interpret Data using Bar Graphs Game
Shine bright in the maths world by learning how to read and interpret data using bar graphs.
Measurement Games
View all 125 games-
VIEW DETAILS
 Capacity
Guess the Correct Unit of Capacity Game
Have your own maths-themed party by learning to identify the correct unit of capacity.
-
VIEW DETAILS
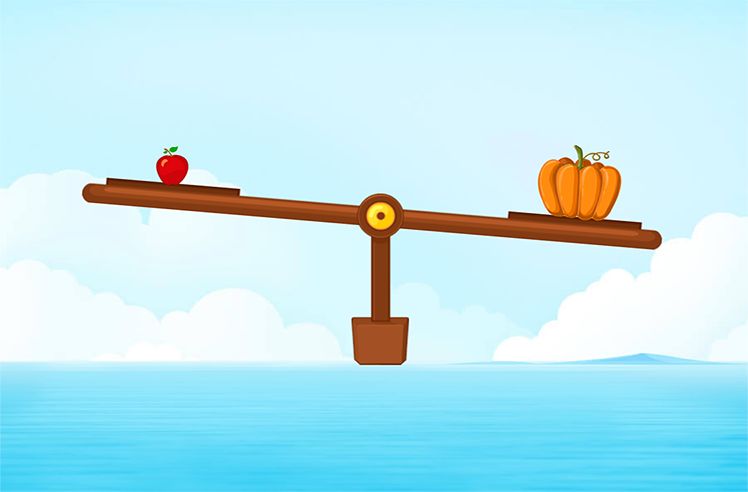 Weight
Identify the Heavier Object Game
Shine bright in the maths world by learning how to identify the heavier object.
-
VIEW DETAILS
 Length
Identify the Object with Shorter Length Game
Use your measurement skills to identify the object with the shorter length.
-
VIEW DETAILS
 Height
Identify the Object with Shorter Height Game
Shine bright in the maths world by learning how to identify the object with the shorter height.
Time Games
View all 35 games-
VIEW DETAILS
 Time In Hours
The Hour Hand Game
Add more arrows to your child’s maths quiver by playing 'The Hour Hand' game.
-
VIEW DETAILS
 Time In Quarter Hours
Identify Quarter Past and Quarter To Game
Take a look at how to identify 'Quarter Past' and 'Quarter To' with this time game.
-
VIEW DETAILS
 Time In Half Hours
Read Time in Half Hours Game
Shine bright in the maths world by learning how to read time in half hours.
-
VIEW DETAILS
 Am And Pm
Relate Activities with A.M. and P.M. Game
Shine bright in the maths world by learning how to relate activities with A.M. and P.M.
Money Games
View all 60 games-
VIEW DETAILS
 Counting Money
Count Money with Coins of a Type Game
Help your child take flight by learning how to count money with coins of a type.
-
VIEW DETAILS
 Compare Money
Order Coins by their Values Game
Add more arrows to your child’s maths quiver by ordering coins by their values.
-
VIEW DETAILS
 Identify Coins
Different Types of Coins Game
Explore different types of coins with your little one.
-
VIEW DETAILS
 Add And Subtract Money
Add the Given Amounts of Money Game
Shine bright in the maths world by learning how to add the given amounts of money.
Algebra Games
View all 54 games-
VIEW DETAILS
 Factors And Multiples
Fill in the Missing Multiples Game
Sharpen your maths skills by filling in the missing multiples.
-
VIEW DETAILS
 Expressions And Equations
Understand the Equal Sign Game
Shine bright in the maths world by understanding the equal sign.
-
VIEW DETAILS
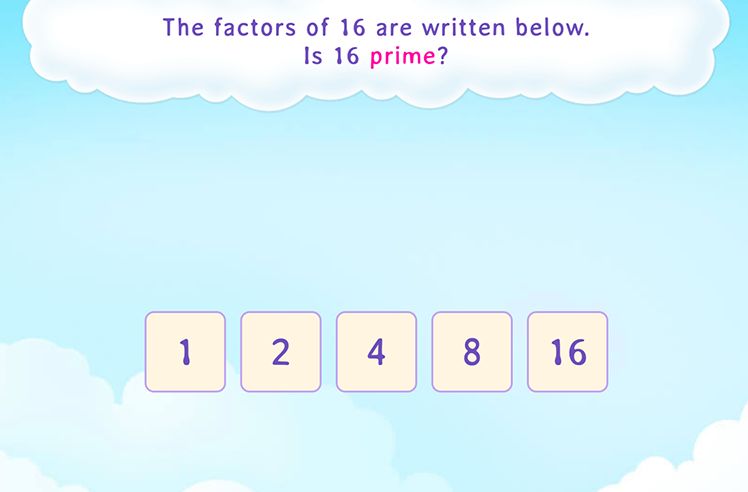 Prime And Composite Numbers
Choose the Prime Number Out of the Given Numbers Game
Kids must choose the prime number out of the given numbers to practice algebra.
-
VIEW DETAILS
 Number Patterns
Count On by 2s Game
Enjoy the marvel of mathematics by exploring how to count on by 2s.
Word Problems Games
View all 97 games-
VIEW DETAILS
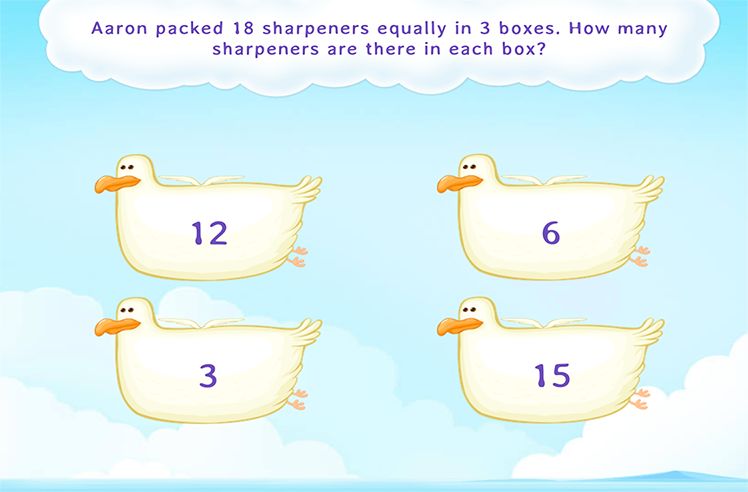 Division Word Problems
Solve Word Problems on Division Game
Learn to solve maths problems by solving word problems on division.
-
VIEW DETAILS
 Addition Word Problems
Solve 'Add To' Scenarios Game
Add more arrows to your child’s maths quiver by solving 'Add To' scenarios.
-
VIEW DETAILS
 Multiplication Word Problems
Solve the Word Problems Related to Multiplication Game
Unearth the wisdom of mathematics by learning to solve word problems related to multiplication.
-
VIEW DETAILS
 Subtraction Word Problems
Solve 'Take Apart' Scenarios Game
Take the pressure off by simplifying subtraction by solving 'Take Apart' scenarios.
All Maths Games
-
VIEW DETAILS
 Number Sense
Quickly Tell the Number of Things up to 10 Game
Have your own maths-themed party by learning how to quickly tell the number of things up to 10.
-
VIEW DETAILS
 Addition
Add Two Numbers (Up to 5) Game
Ask your little one to add two numbers (Up to 5) to play this game.
-
VIEW DETAILS
 Division
Divide Objects into Equal Groups Game
Add more arrows to your child’s maths quiver by helping them divide objects into equal groups.
-
VIEW DETAILS
 Decimals
Use Words to Identify Decimal Notations Game
Ask your little one to use words to identify decimal notations to play this game.
-
VIEW DETAILS
 Time
TimeThe Minute Hand Game
Take a look at the minute hand with this fun game about time.
-
VIEW DETAILS
 Money
MoneyRepresent Money using Symbols Game
Shine bright in the maths world by learning how to represent money using symbols.
-
VIEW DETAILS
 Word Problems
Word Problems to Count by Tens Game
Shine bright in the maths world by learning how to solve word problems to count by tens.
-
VIEW DETAILS
 Number Sense
Identify Embedded Numbers Game
Help your child take flight by learning how to identify embedded numbers.
-
VIEW DETAILS
 Addition
Finding Sum (Up to 10) Game
Dive deep into the world of addition by finding the sum (up to 10).
-
VIEW DETAILS
 Subtraction
Find One Less Game
Unearth the wisdom of mathematics by learning how to find one less.
-
VIEW DETAILS
 Multiplication
Find Equal Groups and Size of Group Game
Practice the superpower of multiplication by learning to find equal groups and the size of group.
-
VIEW DETAILS
 Division
Use Models to Relate Multiplication and Division Game
Enjoy the marvel of mathematics by learning to use models to relate multiplication and division.
-
VIEW DETAILS
 Fractions
Partition to Match the Fractions Game
Have your own maths-themed party by learning how to partition to match the fractions.
-
VIEW DETAILS
 Decimals
Fill in to Show Equivalence Between Mixed and Decimal Numbers Game
Sharpen your maths skills by filling in to show the equivalence between mixed and decimal numbers.
-
VIEW DETAILS
 Geometry
Find Shapes All Around Us Game
Ask your little one to find and identify the different shapes around us to play this game.
-
VIEW DETAILS
 Data Handling
Sort Objects by Color Game
Dive deep into the world of measurement by sorting objects by color.
-
VIEW DETAILS
 Measurement
Identify Which Object is Longer Game
Kids must identify which object is longer to practice measurement.
-
VIEW DETAILS
 Money
MoneyUse Symbols to Represent Money Game
Unearth the wisdom of mathematics by learning how to use symbols to represent money.
-
VIEW DETAILS
 Algebra
Identify the Equivalent Expression Game
Shine bright in the maths world by learning how to identify the equivalent expression.
-
VIEW DETAILS
 Word Problems
Solve Word Problems Related to Multiplicative Comparison Game
Use your maths skills to solve word problems related to multiplicative comparison.
-
VIEW DETAILS
 Subtraction
Subtraction with Pictures Game
Shine bright in the maths world by learning how to subtract with pictures.
-
VIEW DETAILS
 Multiplication
Create Equal Groups Game
Make learning multiplication easy by creating equal groups.
-
VIEW DETAILS
 Division
Identify the Related Division Sentence Game
Enter the madness of maths-multiverse by exploring how to identify related division sentences.
-
VIEW DETAILS
 Fractions
Choose the Correct Partition to Match the Fraction Game
Shine bright in the maths world by learning to choose the correct partition to match the fraction.
-
VIEW DETAILS
 Geometry
Match Triangles and Squares Game
Enter the madness of maths-multiverse by exploring how to match triangles and squares.
-
VIEW DETAILS
 Data Handling
Identify Objects by their Name Game
Take a deep dive into the world of maths by identifying objects by their names.
-
VIEW DETAILS
 Algebra
Fill in the Correct Number Using Additive Patterns Game
Fill in the correct number using additive patterns.
-
VIEW DETAILS
 Addition
Solve 'Put Together' Scenarios Game
Shine bright in the maths world by learning how to solve 'Put Together' scenarios.
-
VIEW DETAILS
 Subtraction
Find the Difference Using Models Game
Ask your little one to find the difference using models to play this game.
-
VIEW DETAILS
 Multiplication
Represent Equal Groups Using Repeated Addition Game
Kids must represent equal groups using repeated addition to practice multiplication.
-
VIEW DETAILS
 Fractions
Choose the Correct Partition Game
Apply your knowledge of fractions to choose the correct partition.
-
VIEW DETAILS
 Decimals
Fill in Color to Represent the Decimal Numbers Game
Fill in colors to represent the decimal numbers in this game.
-
VIEW DETAILS
 Geometry
Match Rectangles and Circles Game
Learn to solve maths problems by matching rectangles and circles.
-
VIEW DETAILS
 Data Handling
Sort Objects by their Name Game
Have your own maths-themed party by learning how to sort objects by their name.
-
VIEW DETAILS
 Measurement
Identify the Taller object Game
Shine bright in the maths world by learning how to identify the taller object.
-
VIEW DETAILS
 Time
TimeRead Time in Hours Game
Let your child see the world through maths-colored shades by reading the time in hours!
Your one stop solution for all grade learning needs.
Give your child the passion and confidence to learn anything on their own fearlessly


